
The Book Weakness Map
The Short Answer
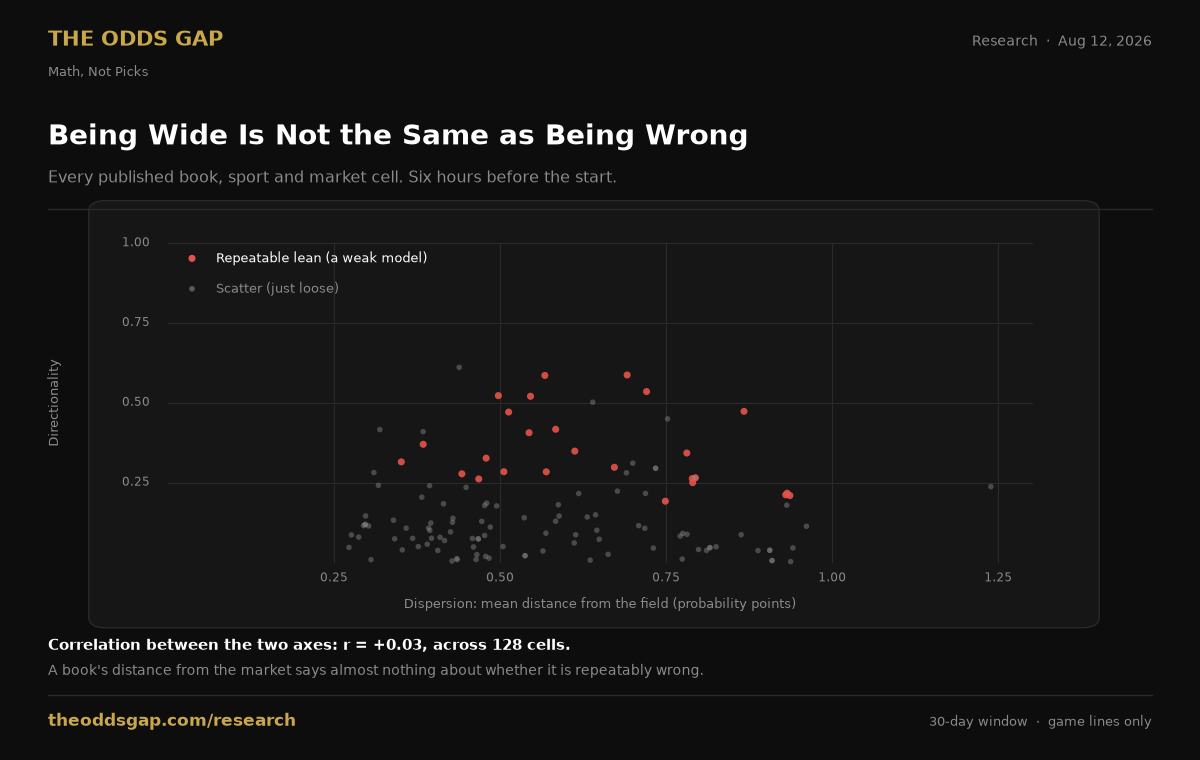
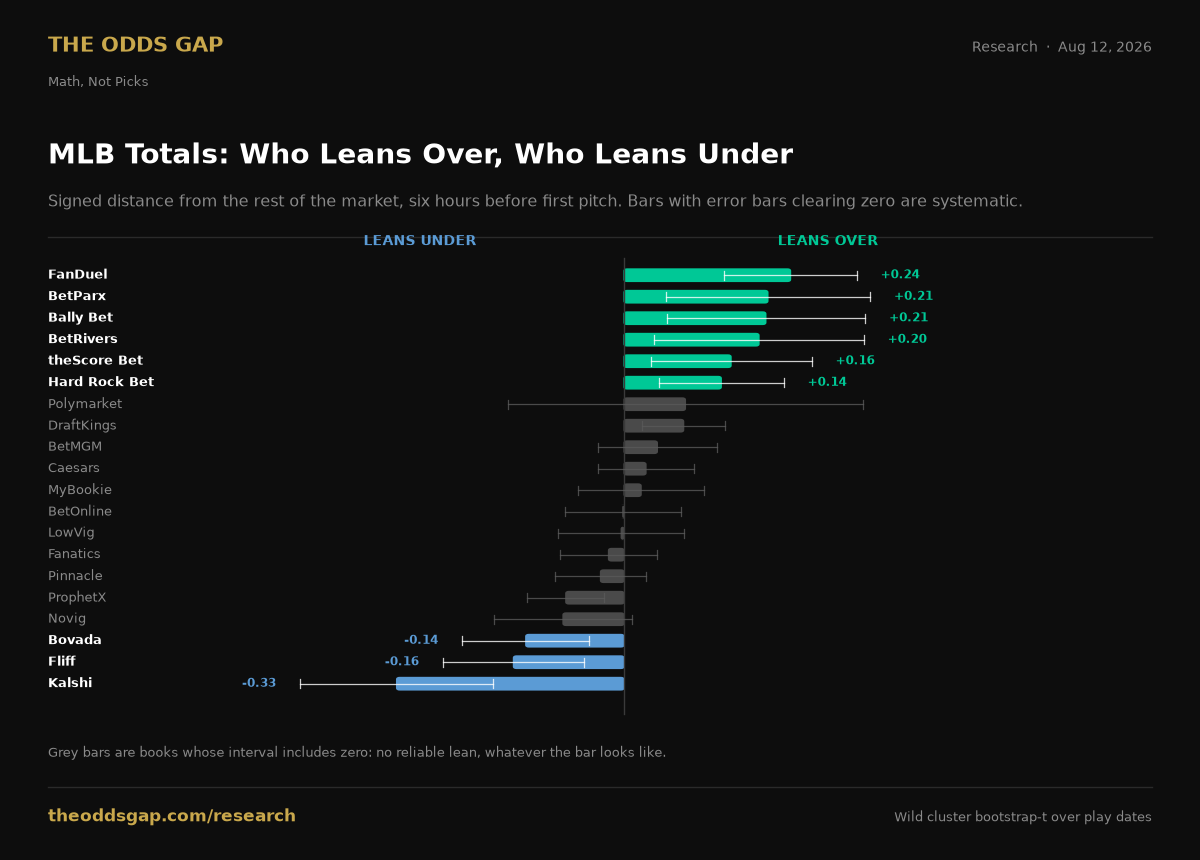
Across 128 book, sport and market cells measured over 30 days of game lines, how far a sportsbook sits from the rest of the market and whether it sits on the same side of it are close to unrelated, at a correlation of r = +0.03. Of the 25 widest cells on the board, 7 carry a repeatable directional lean and 18 are scatter, so a plain distance table cannot tell those two groups apart even though they carry opposite advice. On MLB totals six hours before first pitch, FanDuel, BetPARX, Bally Bet, BetRivers, theScore Bet and Hard Rock Bet all lean Over against the rest of the market while Kalshi, Bovada and Fliff lean Under, and Kalshi's 0.33 probability point Under lean is the largest on any high-volume market.
The question
An earlier study here measured how far each sportsbook sat from the rest of the market as a game approached. It ended by admitting its own limit: distance from the field tells you a book is doing its own thing, not whether its own thing is wrong. The commenter who prompted that study asked the obvious follow-up, which was to find where each book actually runs a weak model rather than simply a wide one. This is that study.
Why the distinction is the whole thing
Two books can sit the identical distance from the consensus and mean opposite things by it.
A book scattered on both sides of the field is loose. Wide margins, a slow refresh, a thin trading desk. Half its prices are better for you than the market and half are worse, and that averages out to noise you can shop through.
A book that lands on the same side of the field over and over is not being random. It has an opinion, the opinion repeats, and on the evidence of every other book it is wrong in a fixed direction. Only that second one is a weakness in the sense a bettor means.
So every cell in this study carries three numbers instead of one: dispersion (mean absolute distance from the market), bias (mean signed distance, with an interval), and directionality, the ratio between them. Zero is a book scattered evenly around the market. One is a book that lands on the same side every single time.
What it found
The headline is the thing the previous study could not have seen. Across the 128 published book, sport and market cells, the correlation between how wide a book is and how directional it is comes out at r = +0.03. They are essentially unrelated. Of the 25 widest cells on the board, 7 carry a repeatable lean and 18 are scatter. On a plain distance table those two groups are indistinguishable, and they carry opposite advice about where to shop.
Second, MLB totals split the board into two camps that hold for a month. FanDuel, the three Kambi books, theScore Bet and Hard Rock all lean Over against the rest of the market. Kalshi, Bovada and Fliff lean Under. Kalshi is the largest single lean on any high-volume market at 0.33 probability points, and 59 percent of its distance from the field is that one direction rather than noise.
Third, six books show no material directional lean anywhere on the board at all: Pinnacle, DraftKings, Fanatics, Caesars, BetOnline and LowVig. Pinnacle being on that list is expected, since it is the book the rest of the market tends to follow. DraftKings and Fanatics earning it is the more interesting result, and it is worth saying plainly that several of these books are wide. Wide is not the same as wrong, and this is the list where the distance really is just scatter.
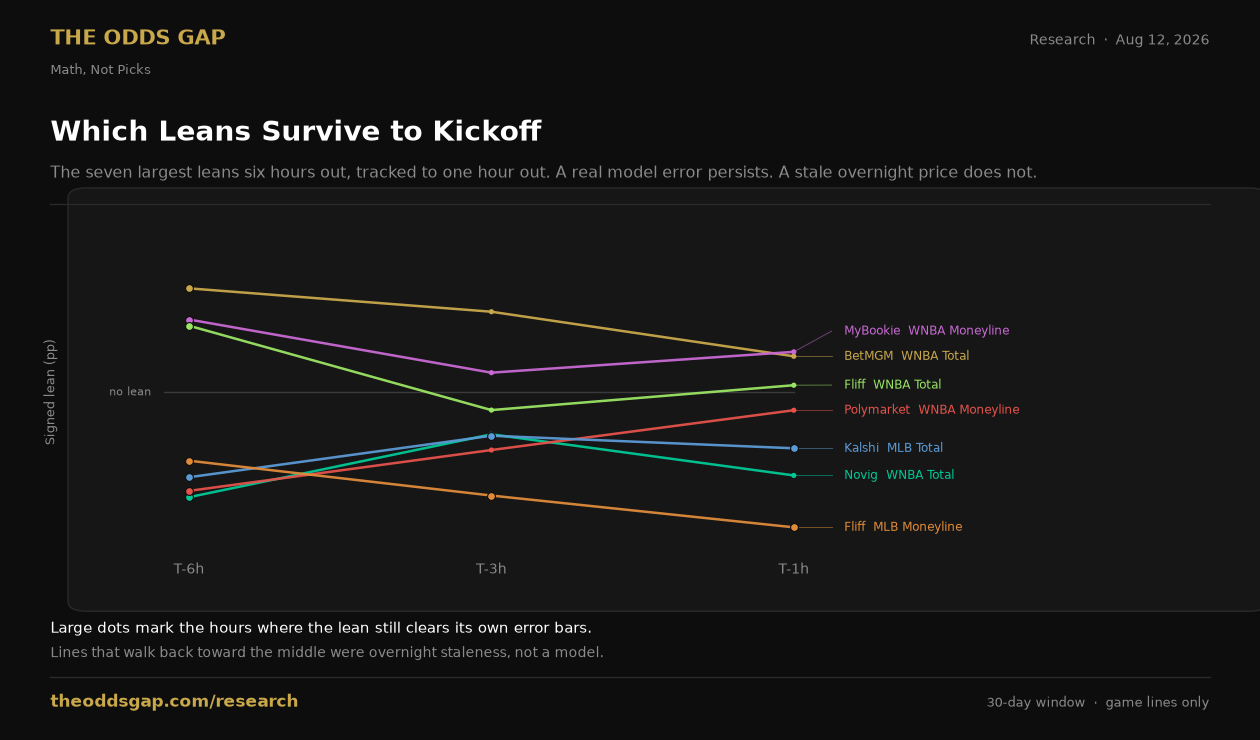
The leans also behave differently as kickoff approaches, which is what separates a model from a stale price. Fliff's MLB moneyline lean grows from 0.27 points to 0.53 as first pitch nears. The Kambi books' Over lean on MLB totals disappears entirely by one hour out, which makes it overnight staleness rather than an opinion.
Method
Every book's price on every game is captured about once an hour. For each game, market and book the study takes the stored price nearest to six hours, three hours and one hour before the scheduled start, and compares it to the median of the rest of the market at that same minute.
Everything is in probability points on the de-vigged fair price, so 1.0 means one percentage point of implied probability. Probability rather than American odds, because ten cents means something very different at -110 than at +400 and averaging cents across a board quietly overweights longshots. Exchange prices have the taker fee applied and are the price a hundred dollars actually fills at, walked down the order book.
One side is kept per market (home for moneyline and spread, over for totals). A two-way market de-vigs to probabilities that sum to one, so counting both sides would double every sample count and make the intervals look twice as good as they are. Spreads and totals are only ever compared on a matching number, because Over 8.5 and Over 9.0 are different bets.
The field is built from platforms, not books
Twenty books is not twenty opinions. Bally Bet, BetPARX and BetRivers run on one pricing engine, and BetOnline and LowVig are one operator with two margins. A naive median counts the first group three times and lets a skin help form the consensus it is then measured against.
For a study about direction that is not a rounding error, it is the specific thing that would break it. If a cluster leans, its lean is partly baked into the field it gets compared with, which drags its own measured bias toward zero. So each engine contributes one node, and no book is ever compared against a field containing its own sisters. On spreads and totals the consensus number is the mode across those nodes too, because three skins voting as one can otherwise carry a line to consensus and leave every independent book on the real market number scored as the odd one out.
Intervals
Wild cluster bootstrap-t over play dates. The previous study published a plain interval that treated every observation as an independent draw. It is not: one day's games share weather, umpires, a slate of correlated markets and a single pass of every trading desk. Someone made that objection about a different piece of work here and was right, so it now applies to everything.
The width change is modest, a median 1.24 times, and it still changed the answer. Fifteen cells would have been reported as a systematic lean under the naive interval and are not reported as one here. Two go the other way. The correction removes findings on net, which is what a correction that was actually needed looks like.
A finding that was a bug
The first run of this study reported its largest weak model by an order of magnitude: one book leaning 15 probability points on MLS moneylines, with a directionality of 1.00 and 100 percent of its samples on one side. That is not a triumphant result, it is a data bug wearing one, and it was.
The book was quoting MLS two-way, home and away with no draw, which is a draw-no-bet market and a genuinely different product. Its price de-vigged over two outcomes and came out at 77 percent implied where every three-way book sat between 55 and 62. It was not a lean. It was two different bets in one column. A book now only enters a three-way market's comparison when it quoted all three outcomes, so every price in the field is a de-vig over the same outcome set. Samples above the study's own implausibility bar fell from 91 to 1 when that guard went in.
Caveats
The capture is hourly, not continuous. A sample is the nearest stored price within thirty minutes of the target, so a genuine spike between captures is invisible. A book that is fast and wrong for twenty minutes looks identical here to a book that never moved.
A lean against the field is not proof the book is wrong. It is proof the book disagrees with the other books, repeatedly. The field is not the truth, it is the consensus, and consensus is occasionally the thing that is wrong. Settling that would need results, not prices, and this study has no results in it.
This is one window. Thirty days is enough to separate the ends of these tables and not enough to rank the middle. A trading desk can change its model in an afternoon. Treat every number as a measurement of a period, not a property of a brand.
Platform clustering is a judgment call with evidence behind it. The two clusters were verified at 98 to 99 percent price identity and against public contract record, but BetRivers prices its own baseball on top of the shared engine and is still mapped into the cluster here. That is the conservative direction for this study and it does slightly flatten a book that partly deserves its own node.
Exchanges are in the tables and are a different kind of object. An order book has no house opinion. A lean there means the crowd leaned, which is a real fact about where the money sat and not a statement about anyone's model.
Scope, said plainly. Game lines only. This site published derived exchange prop prices that could not actually be bet, found it on 2026-08-12, killed it the same day and retired the published record that depended on it. Game lines were checked and were never exposed to that failure, which is exactly why this study is game lines and why the prop version waits for clean data. The full account is in the exchange price autopsy.
One number was rebuilt by hand. Two cells were recomputed straight from the raw exported rows by separate code sharing nothing with the study. Both matched to four decimal places.
Every Book on MLB Totals, Ranked by Lean
Six hours before first pitch, ordered from the strongest Over lean to the strongest Under lean. Figures are probability points on the de-vigged fair price, so +0.24 means the book's de-vigged price sits 0.24 percentage points of implied probability above the rest of the market. A lean is only named where the 95 percent interval clears zero.
| # | Book | Signed Lean | 95% Interval | Directionality | Verdict | Samples |
|---|---|---|---|---|---|---|
| 1 | FanDuel | +0.24 | +0.15 to +0.34 | 0.42 | Over | 320 |
| 2 | BetParx | +0.21 | +0.06 to +0.36 | 0.26 | Over | 299 |
| 3 | Bally Bet | +0.21 | +0.06 to +0.35 | 0.26 | Over | 299 |
| 4 | BetRivers | +0.20 | +0.04 to +0.35 | 0.25 | Over | 295 |
| 5 | theScore Bet | +0.16 | +0.04 to +0.27 | 0.33 | Over | 202 |
| 6 | Hard Rock Bet | +0.14 | +0.05 to +0.23 | 0.37 | Over | 204 |
| 7 | Polymarket | +0.09 | -0.17 to +0.35 | 0.14 | No reliable lean | 130 |
| 8 | DraftKings | +0.09 | +0.03 to +0.15 | 0.28 | No reliable lean | 320 |
| 9 | BetMGM | +0.05 | -0.04 to +0.14 | 0.12 | No reliable lean | 320 |
| 10 | Caesars | +0.03 | -0.04 to +0.10 | 0.08 | No reliable lean | 326 |
| 11 | MyBookie | +0.03 | -0.07 to +0.12 | 0.05 | No reliable lean | 307 |
| 12 | BetOnline | -0.00 | -0.09 to +0.08 | 0.00 | No reliable lean | 316 |
| 13 | LowVig | -0.00 | -0.10 to +0.09 | 0.01 | No reliable lean | 316 |
| 14 | Fanatics | -0.02 | -0.09 to +0.05 | 0.08 | No reliable lean | 327 |
| 15 | Pinnacle | -0.03 | -0.10 to +0.03 | 0.08 | No reliable lean | 311 |
| 16 | ProphetX | -0.09 | -0.14 to -0.03 | 0.18 | No reliable lean | 342 |
| 17 | Novig | -0.09 | -0.19 to +0.01 | 0.19 | No reliable lean | 194 |
| 18 | Bovada | -0.14 | -0.24 to -0.05 | 0.28 | Under | 321 |
| 19 | Fliff | -0.16 | -0.26 to -0.06 | 0.28 | Under | 198 |
| 20 | Kalshi | -0.33 | -0.47 to -0.19 | 0.59 | Under | 186 |
Built from the published snapshot dated 2026-08-12, the same file linked under the data below. Rebuild it yourself and you should get this table back exactly.
The Data Behind This
- Machine-readable weakness snapshot (JSON, 390 cells)
- The raw price history this was computed from (CSV)
Every figure above was computed from the site's own price archive, and the whole archive is free to download on the historical odds data page: one row per snapshot, book, market and side, with de-vigged fair probabilities already in the file. If you rebuild this study from it and get a different answer, that is a result worth sending to [email protected].
Revision History
The Odds Gap Daily
One email each morning with the biggest gaps on the board.
Looking for live prices? Use Unlock Live at the top of the page.