
Tuesday Tool Series #10: Book Comparison
Tuesday tool series, article 10 of 19. The tool: Book Comparison at theoddsgap.com/books
Tuesday Tool Article #10. Book Comparison. The leaderboard numbers below were read off the Book Comparison page at 3:30 PM ET on Monday, October 19, 2026, covering the seven days before it. The timing and Pinnacle studies come from our hourly pregame scans of NFL, college football and NHL game lines from September 19 to October 19, 2026.
Everybody has a book. It's the app on your home screen, the one with your money in it, the one you open without thinking. Ask why and you'll hear "their lines are better," or "they're the sharpest," or "they always have the best odds on totals."
Almost nobody has checked. Checking means writing down every book's price on every game, every day, for weeks, and then counting. So the favorite book stays the favorite because it feels right.
We do the writing down for you. Every scan of every game goes into the archive, and the Book Comparison page does the counting.
What the tool does
Book Comparison answers one question: over a stretch of days, how often did each book have the best price?
It counts every side of every game we scanned, checks which book paid the most on it, and gives each book a best-price share. A tie counts for every book in it, so the shares can add up to more than 100%.
There are two ways to count. Matched Lines only uses markets that every book you selected quoted at the same line, so every book is graded on exactly the same bets. Market Breadth counts every side each book quoted, so a book that posts more markets gets more chances. You pick the window (up to 30 days for Matched Lines), the sport, the market type, and the books. Below the rankings, the same count is broken out by sport, and there are head-to-head pages that narrow it to two books.
A real example
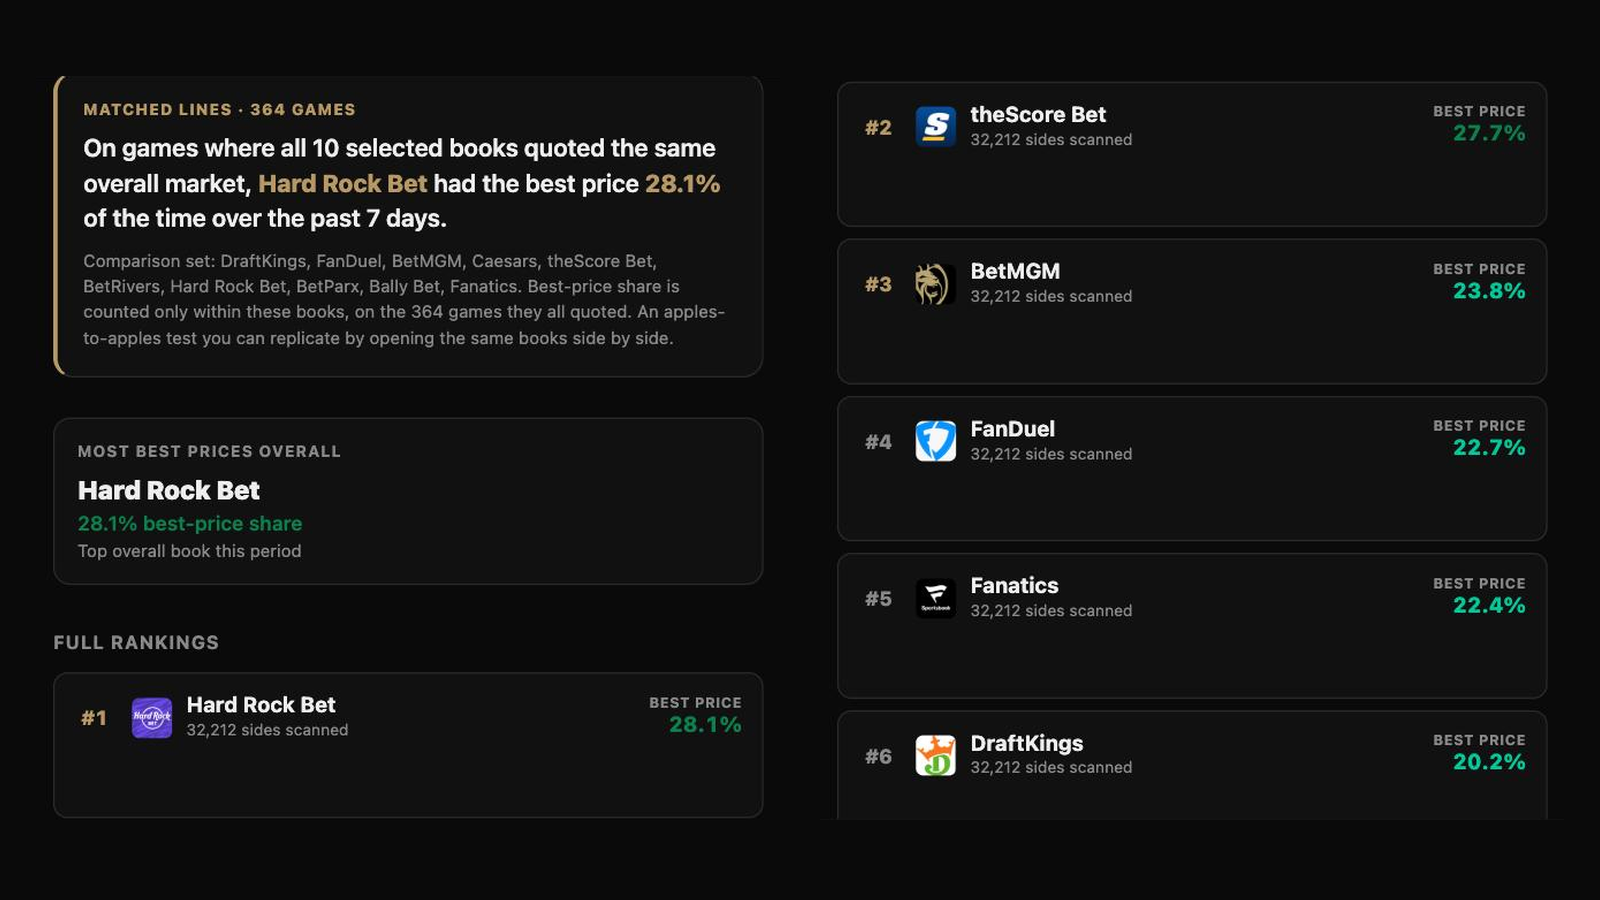
US sportsbooks only, Matched Lines, the last seven days. 364 games where all ten books quoted the same market, 32,212 sides. Here is how often each one had the best price, best to worst:
- Hard Rock Bet: 28.1%
- theScore Bet: 27.7%
- BetMGM: 23.8%
- FanDuel: 22.7%
- Fanatics: 22.4%
- DraftKings: 20.2%
- Bally Bet: 19.3%
- BetParx: 15.6%
- Caesars: 15.6%
- BetRivers: 15.5%
The leader was best less than three times in ten. On the other 72% of those sides, another book paid more. No single book wins most of the time, which is the whole reason line shopping works.
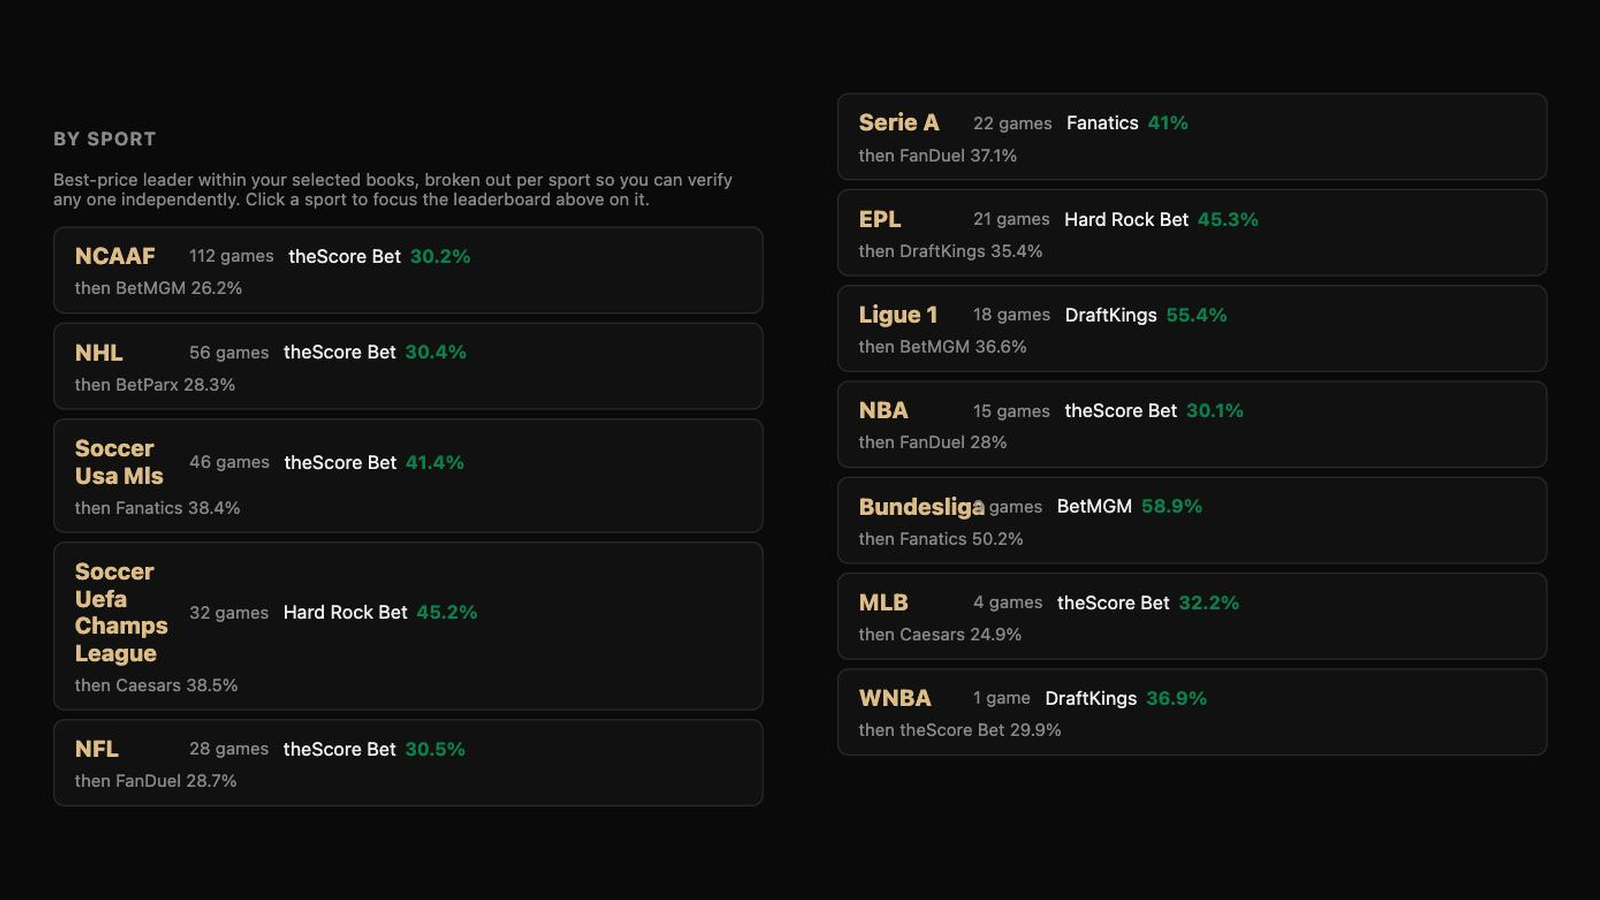
The leader changes by sport. In the same seven days, theScore Bet led NFL at 30.5% with FanDuel right behind at 28.7%. Hard Rock Bet led the English Premier League. DraftKings led Ligue 1 at 55.4%. Your best book depends on what you bet.
Add the exchanges and the picture flips. Turn on every book and exchange and the Matched Lines view drops to 240 games all fifteen quoted. Novig had the best price on 71.4% of them, and ProphetX was next at 12.4%. Exchanges charge little or nothing on top of the price, so they win most head-to-head counts.
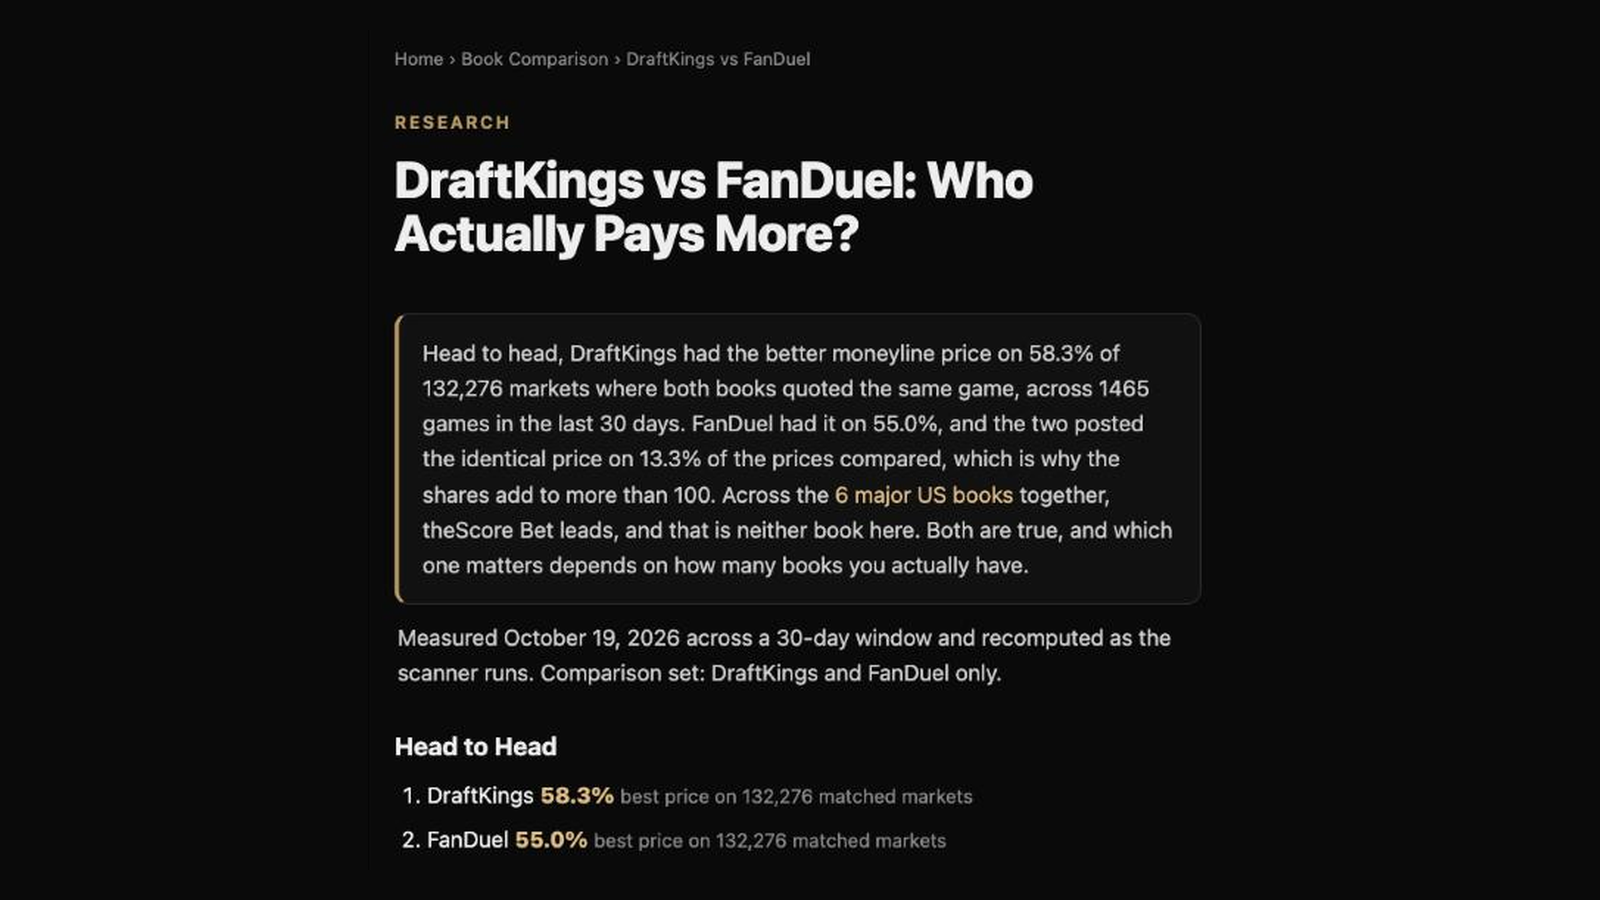
Head to head, it's close. Over the last 30 days, DraftKings had the better moneyline than FanDuel on 58.3% of 132,276 markets both quoted, and FanDuel had it on 55.0%. They were identical on 13.3%. If you hold both, you want both.
When the books are best
The leaderboard tells you who wins. We wanted to know when. So we went through 30 days of hourly scans and asked three questions.
Who posts first? Across 30 NFL games, DraftKings and FanDuel already had prices when our scanner started tracking each game, about 12 days before kickoff. Polymarket US joined within an hour, Caesars within two, and BetRivers, BetParx and Bally Bet within four. Novig followed about two days later. BetMGM, theScore Bet and ProphetX typically arrived about five days after the first books, and Hard Rock Bet and Fanatics about five and a half to six. Texans at Jaguars on October 18 is the typical shape: DraftKings and FanDuel on Tuesday, October 6, Novig on Thursday, ProphetX and BetMGM on Sunday night, Hard Rock Bet and Fanatics on Monday morning.
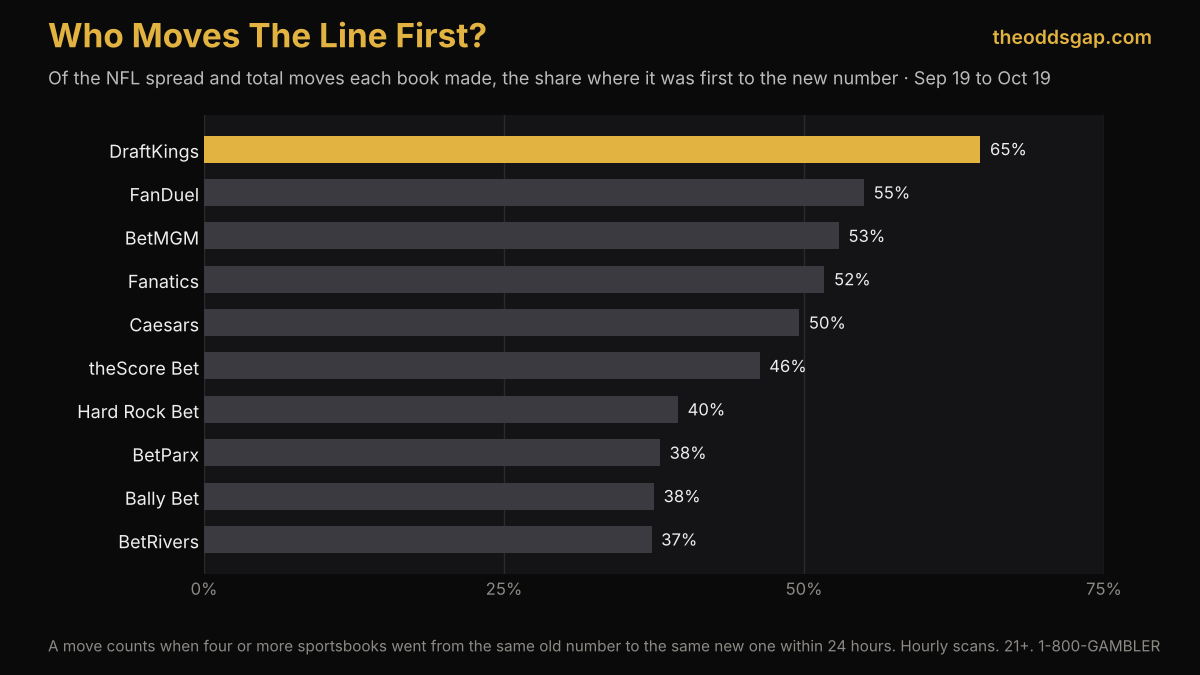
Who moves first? We found 454 NFL spread and total moves where four or more sportsbooks went from the same old number to the same new one within a day. DraftKings was on the new number first on 65% of the moves it made, then FanDuel at 55%, BetMGM at 53%, Fanatics at 52% and Caesars at 50%. BetRivers, BetParx and Bally Bet, which post the same price on about 99% of shared snapshots, were first on 37% to 38%, and typically got there one to two hours after the first book. College football told the same story across 1,743 moves. The practical read: after a line moves, the old number often hangs around somewhere for an hour or two.
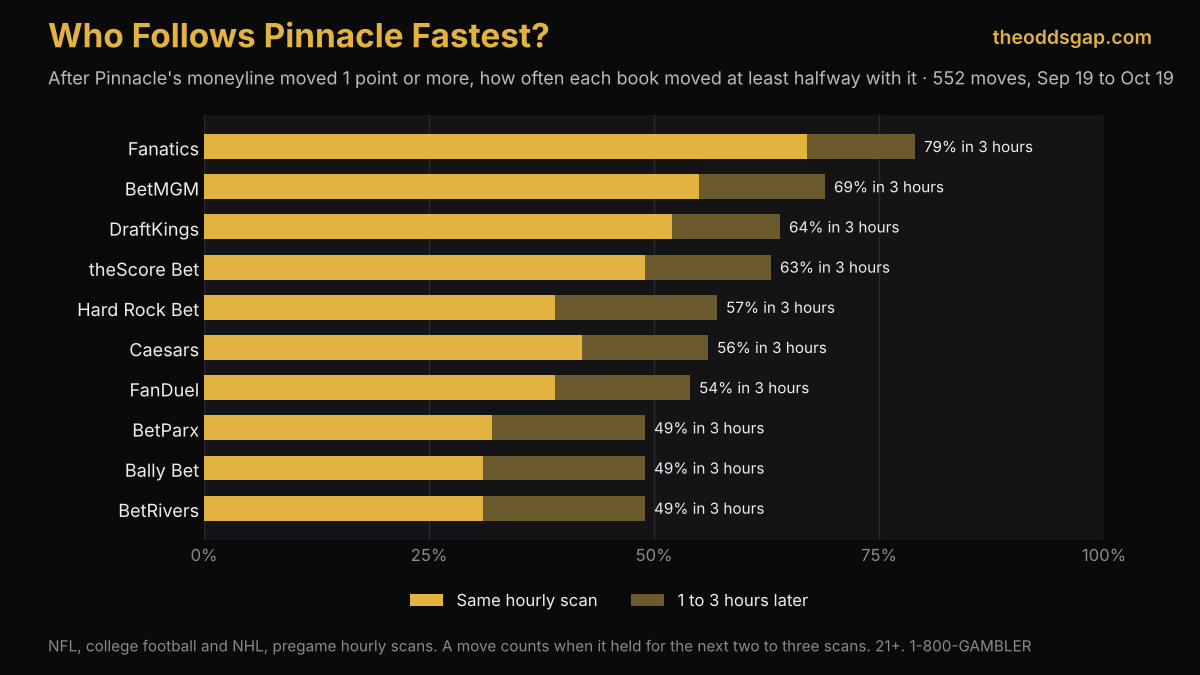
Who follows Pinnacle? Pinnacle is widely treated as the sharpest book in the market, so we used its moneyline as the clock. We found 552 times its de-vigged moneyline moved a point or more and held there for the next two to three scans. Then we checked how long each book took to move at least halfway with it.
- Fanatics: 67% in the same hourly scan, 79% within three hours
- BetMGM: 55% same scan, 69% within three hours
- DraftKings: 52%, then 64%
- theScore Bet: 49%, then 63%
- Caesars: 42%, then 56%
- Hard Rock Bet: 39%, then 57%
- FanDuel: 39%, then 54%
- BetParx, Bally Bet and BetRivers: 31% to 32%, then 49%
Three takes from that.
Fanatics shadows Pinnacle. It matched Pinnacle's move in the same scan two times in three, more than any other US book. When its own moneyline moved a point or more, 44% of those moves landed in the same scan as Pinnacle's.
FanDuel, Hard Rock Bet and theScore Bet run their own numbers. They moved their moneylines a point or more 967, 969 and 1,177 times, against 652 for Fanatics and 613 for BetMGM, and 64% to 69% of those moves had no matching Pinnacle move within three hours. Same for the BetRivers group, at 71%. These books are not waiting on anyone.
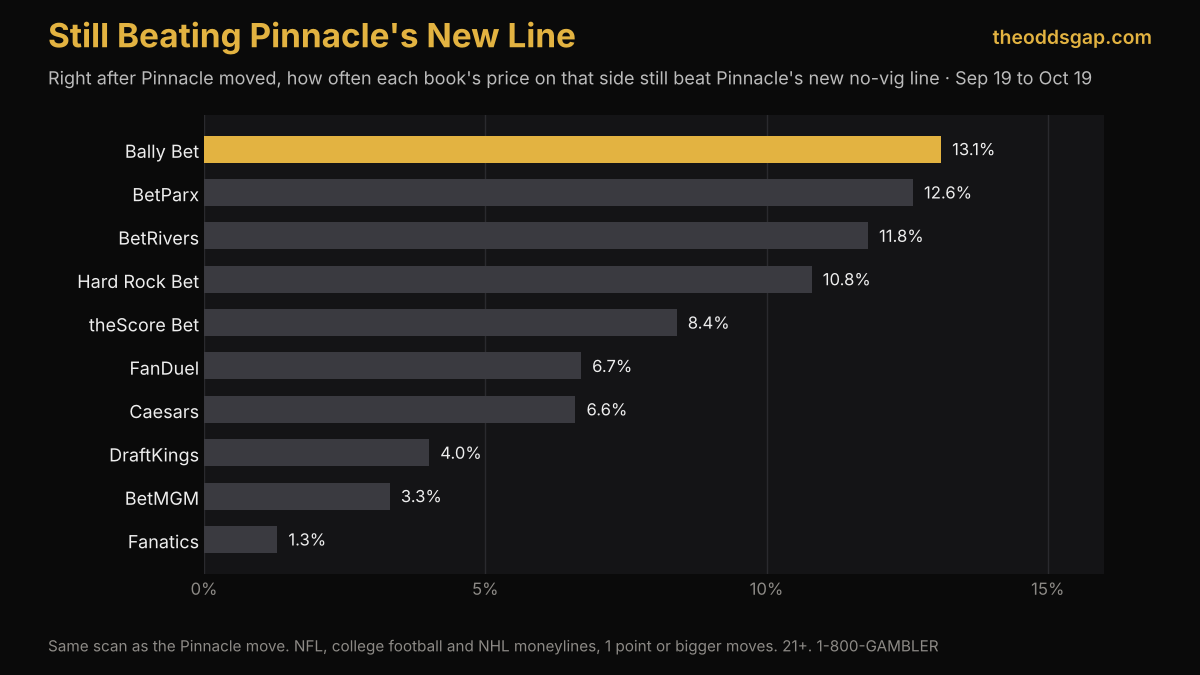
The lag is where the value sits. In the same scan Pinnacle moved, the side it moved toward was still priced better than Pinnacle's new no-vig line at Bally Bet 13.1% of the time, BetParx 12.6%, BetRivers 11.8% and Hard Rock Bet 10.8%. At Fanatics it was 1.3%. That is exactly the kind of gap the +EV board looks for.
And the prediction markets? We ran Novig, ProphetX and Polymarket US through the same test, on NFL and NHL games.
They follow Pinnacle about as fast as the quickest sportsbooks. Novig moved with Pinnacle in the same scan 45% of the time and within three hours 63%. ProphetX was 44% and 59%. Polymarket US was slower to start, at 24% in the same scan, then 53% within three hours. When the exchanges moved a point or more, Pinnacle moved in the same scan 56% to 58% of the time for Novig and ProphetX, more than any US sportsbook. For Polymarket US, Pinnacle had already moved first 29% of the time, the highest of anyone we track. Polymarket US mostly follows.
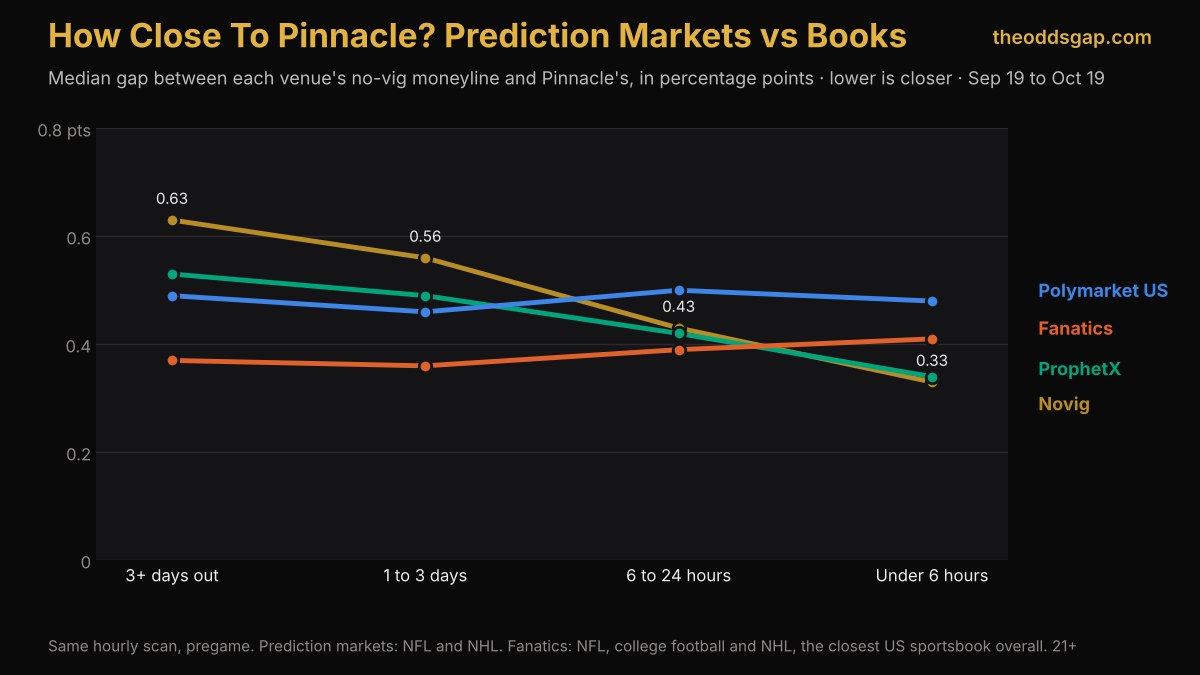
The more interesting number is how close they sit to Pinnacle. We took each venue's moneyline with the vig removed and measured the gap to Pinnacle's, scan by scan. Fanatics was the closest US sportsbook, at a median of 0.37 points, and it barely changes all week. Novig starts the week further away, at 0.63 points three or more days out, and closes to 0.33 in the last six hours. ProphetX goes from 0.53 to 0.34. In the final hours before kickoff, the two exchanges agree with Pinnacle more closely than any sportsbook does. Polymarket US stays around 0.48 the whole way.
That fits everything above. Early in the week the exchange prices wander further from the sharp line. As the game gets close they pull in tight, most likely because more people are trading by then, and that is exactly when Novig takes over the best-price count.
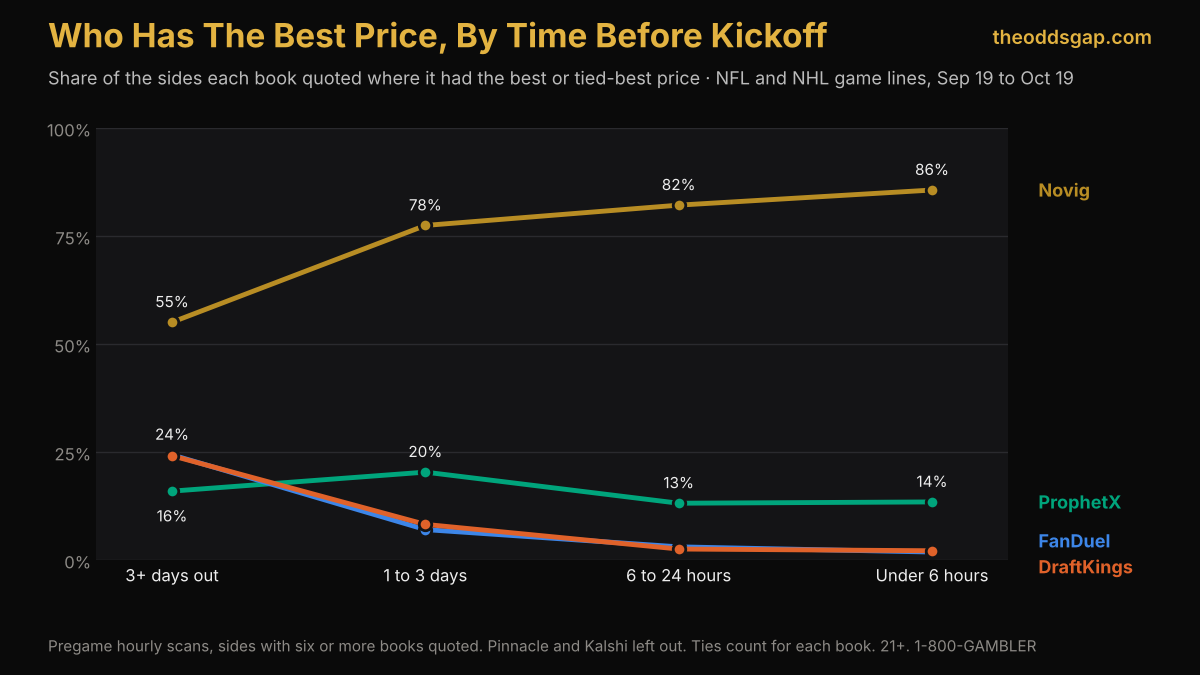
Who's best early, and who's best late? We had a hunch going in: ProphetX first thing in the morning, Novig by the end of the day. The clock barely matters. In every three-hour block we scan, Novig had the best price on 66% to 71% of the NFL and NHL sides it quoted, and ProphetX on 14% to 17%. What matters is how far away the game is:
- 3 or more days out: Novig 55.1%, FanDuel 24.4%, DraftKings 24.2%, ProphetX 16.0%
- 1 to 3 days out: Novig 77.5%, ProphetX 20.4%, DraftKings 8.3%, FanDuel 7.1%
- 6 to 24 hours out: Novig 82.2%, ProphetX 13.2%, FanDuel 3.1%, DraftKings 2.6%
- Under 6 hours: Novig 85.7%, ProphetX 13.5%, DraftKings 2.2%, FanDuel 1.9%
Early in the week, the big sportsbooks are often the best price, partly because fewer books have posted yet. As kickoff gets closer, the exchanges fill in and take over. ProphetX's best stretch is one to three days out. Head to head, Novig beat ProphetX on about 90% of the NFL sides both quoted at every stage. In the NHL, one to three days out, ProphetX beat Novig 15% of the time, against about 5% inside 24 hours. That's the part of the hunch that held up.
How to use it
Open Book Comparison. It's under Research, or go straight to theoddsgap.com/books.
Pick your books. Tap US Sportsbooks, Prediction Markets or All, or check only the books you actually have. The ranking is only counted inside the books you pick.
Pick the view. Matched Lines for a fair head-to-head on the same bets. Market Breadth to see who wins across everything they post.
Pick the window and sport. From the previous day up to 30 days (Market Breadth also has All-Time), and any sport or market type. The By Sport cards show the leader in each one; tap one to focus the rankings on it.
Go head to head. The head-to-head pages narrow it to two books, if you are deciding between the two apps you have.
The method
Every scan, we record every book's price on every side of every game we track. A book has the best price on a side when nobody in your selected set paid more. Ties count for every book in them. Prediction market prices include each venue's trading fees, so they show what a taker actually pays. A book needs 2,000 scans in a view to take a ranked spot; below that it shows in gray, unranked.
For the timing study we used pregame hourly scans only, and only sides where six or more books were quoted. Pinnacle and Kalshi were left out of the best-price and line-move counts; Pinnacle is only used as the reference in the follow and closeness tests. Kalshi is left out of the prediction market comparison. "First" means present in the first hourly scan that had the new number, so two books that moved minutes apart count as tied. In the Pinnacle test, a book "followed" when its own de-vigged moneyline moved at least half as far in the same direction, and a lag is counted in whole hourly scans. Exchanges were left out of the line-move count because their spreads and totals are stored at the consensus number, so they don't move on their own. College football exchange prices were left out of the early and late comparison because most of that month's rows were held back by our game-matching check.
The methodology page covers how every price on the site is read.
What it does not do
This is the section nobody else writes, so here it is.
It is not a grade. We stopped publishing letter grades on purpose. A book near the bottom may be loose rather than wrong, and loose is something you can shop through.
It counts how often, not by how much. A book can win 28% of the time by a cent each and lose by a dime. The share tells you where to look first, not how much you'll save.
It is history, not a promise. Last week's leader can be next week's sixth. Check the window you care about.
It doesn't know your state or your account. A book you can't use or that limits you is still in the count until you uncheck it. Boosts, promos and odds on parlays aren't in it.
First to move isn't the same as right. Moving first says a book reacts fast. It doesn't say the new number was the better one, and our scans are hourly, so anything faster than an hour looks like a tie.
The point
Your favorite book is the best price on some of your bets. The numbers say it's not the best on most of them, and which book is best changes by sport, by market and by how close the game is. The only book that is always best is the one with the best price on that bet, at that moment.
Book Comparison is free.